bGamma
Modern Gamma Spectroscopy Software
The new bGamma spectroscopy Software is an all-inclusive, modern software package for gamma-ray spectrum analysis, radionuclide identification and quantification. The software can analyse any recorded gamma-ray spectrum independently of the detector type, geometry or sample.
bGamma provides all the necessary tools and functionality for performing a detailed analysis of complex gamma-ray spectra and the corresponding radionuclide identification for the given sample.
The new
bGamma software is a comprehensive software package designed from the outset to bring gamma spectrum analysis up to modern requirements.
The analysis of the energy spectra from a radioactive sample using spectroscopic software is a critical step in gamma-ray spectrometry due to the complexities involved. For instance, the spectra may contain large amounts of interference between elemental emissions, complex continuums, a presence of spectrum artefacts (sum and escape peaks) or unknown sample characteristics among many others.
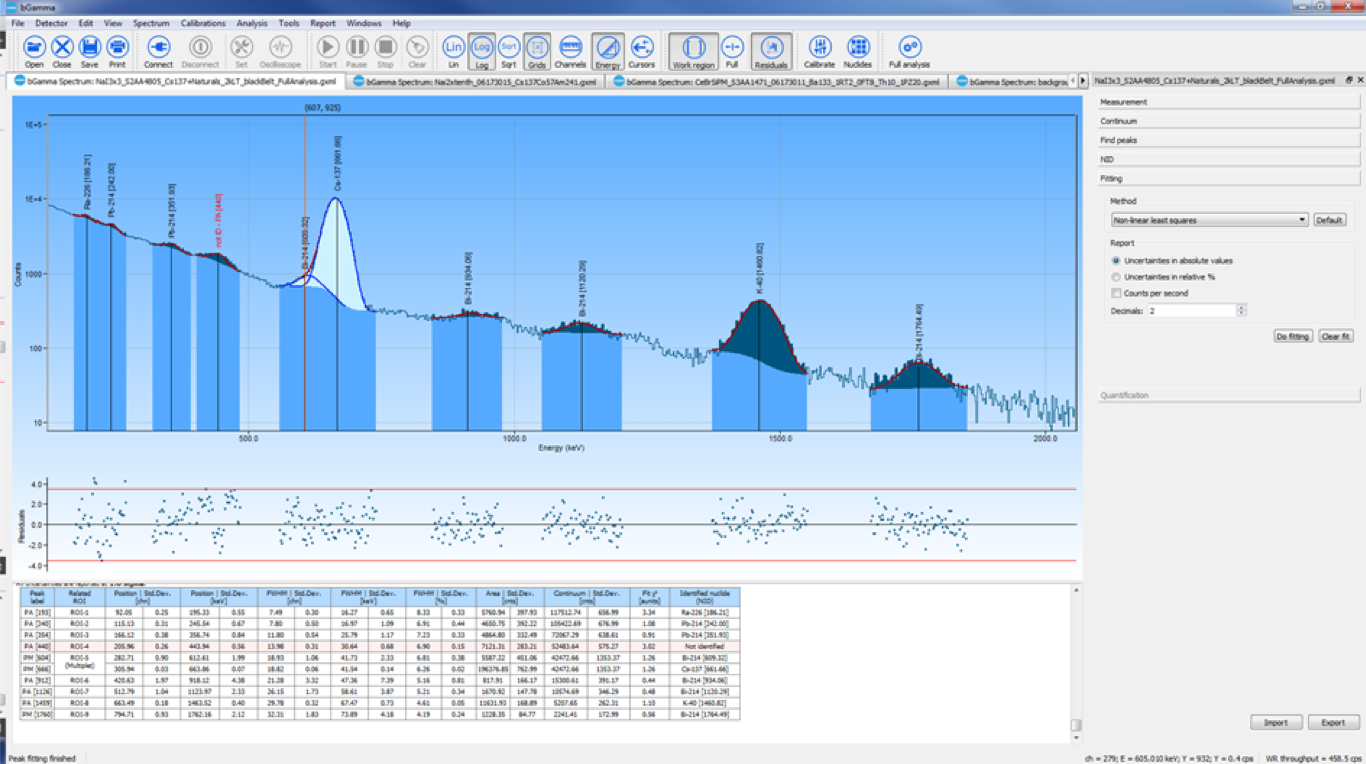
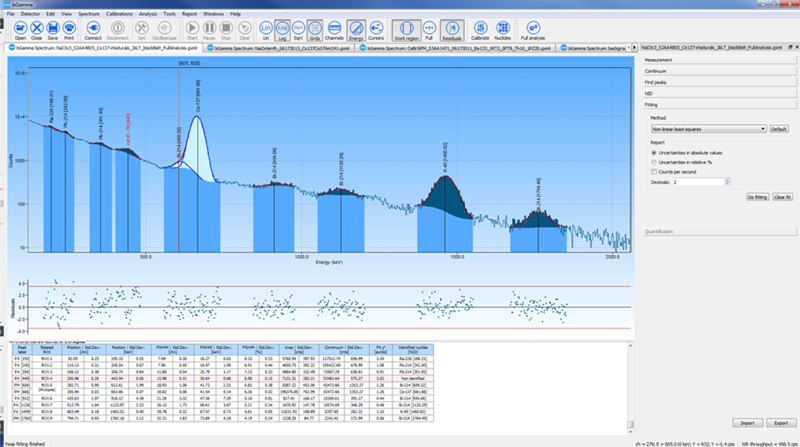
The modern graphical user interface (GUI) designed into our software simplifies this process by bringing intuitive spectrum visualisation and analysis, providing important “visual” feedback of the analysis results.
bGamma software is a multi-document software package allowing the user to analyze multiple-spectra at the same time and/or acquire data from several connected detectors.
The large quantity and variety of calculation algorithms implemented into bGamma allows the user to analyze a broad range of gamma-ray spectra independently of the detector used, e.g. from high-resolution Ge spectra to medium resolution scintillator spectra from CeBr3, LaBr3, or the widely-used NaI(Tl).
bGamma software runs seamlessly on MS Windows, Linux, MAC iOS & Android.
Click on the slider below for detailed screenshots of the bGamma Software:
Features at a glance
- Control the hardware for correct data acquisition
- Controls & visualises the data acquisition
- Advanced, modern GUI for superb spectrum & analysis results visualisation
- Imports spectra from other file formats
- Energy, shape & efficiency calibration for the gamma-ray spectra
- Automatic peak search & peak class identification (singlets, multiplets)
- ROI analysis & calculations
- Fitting of the experimental data to mathematical models, including background subtraction, peak interference correction, etc.
- Nuclide identification with separation from possible spectrum artefacts and structures
- Radionuclide activity calculations
- Runs seamlessly on MS Windows, Linux, MAC iOS


Outstanding Graphical User Interface
Highlights:
- Provision of all modern tools and docking widgets for creation of a visually comprehensive, effective and yet attractive user interface
- Powerful multi-document GUI
- The compelling graphical user interface with elements that provide immediate visual feedback on the spectrum analysis results
- Advance spectrum plot with “multiple-cursors”
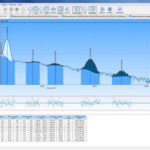
- Provision of spectrum fitting residuals plot
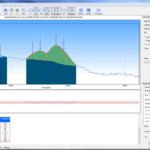
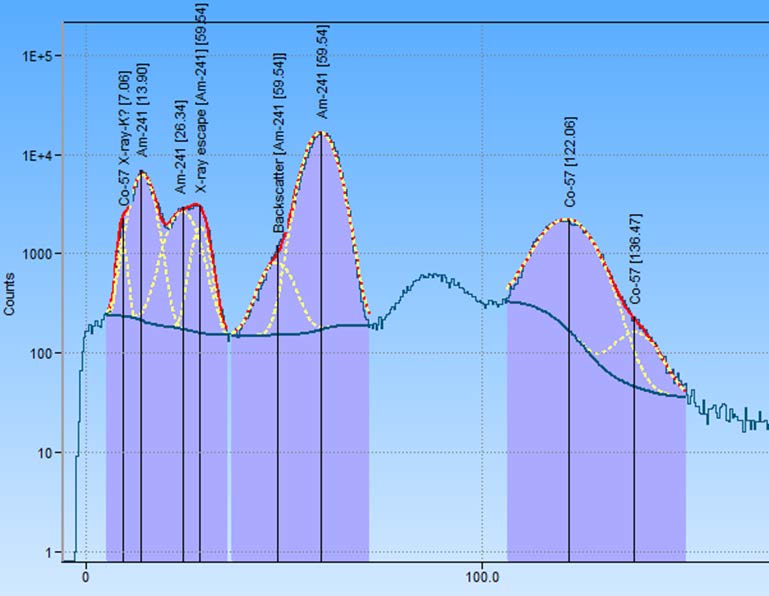
- Visualization of all peak’s fitting components (e.g. continuum, individual peak fitting, total fitting, etc.)
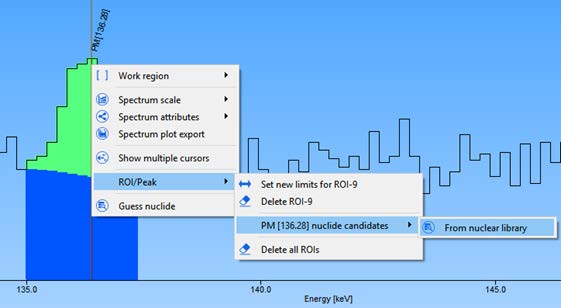
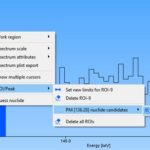
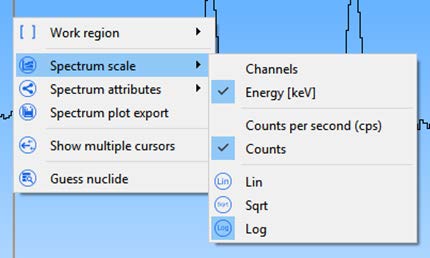
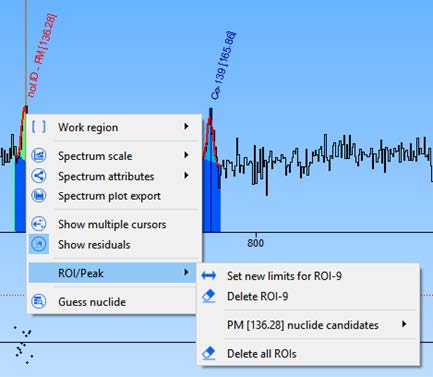
- Use of dynamically created context menu
- Implement toolbars and floating docking windows for displaying numerical and graphical data
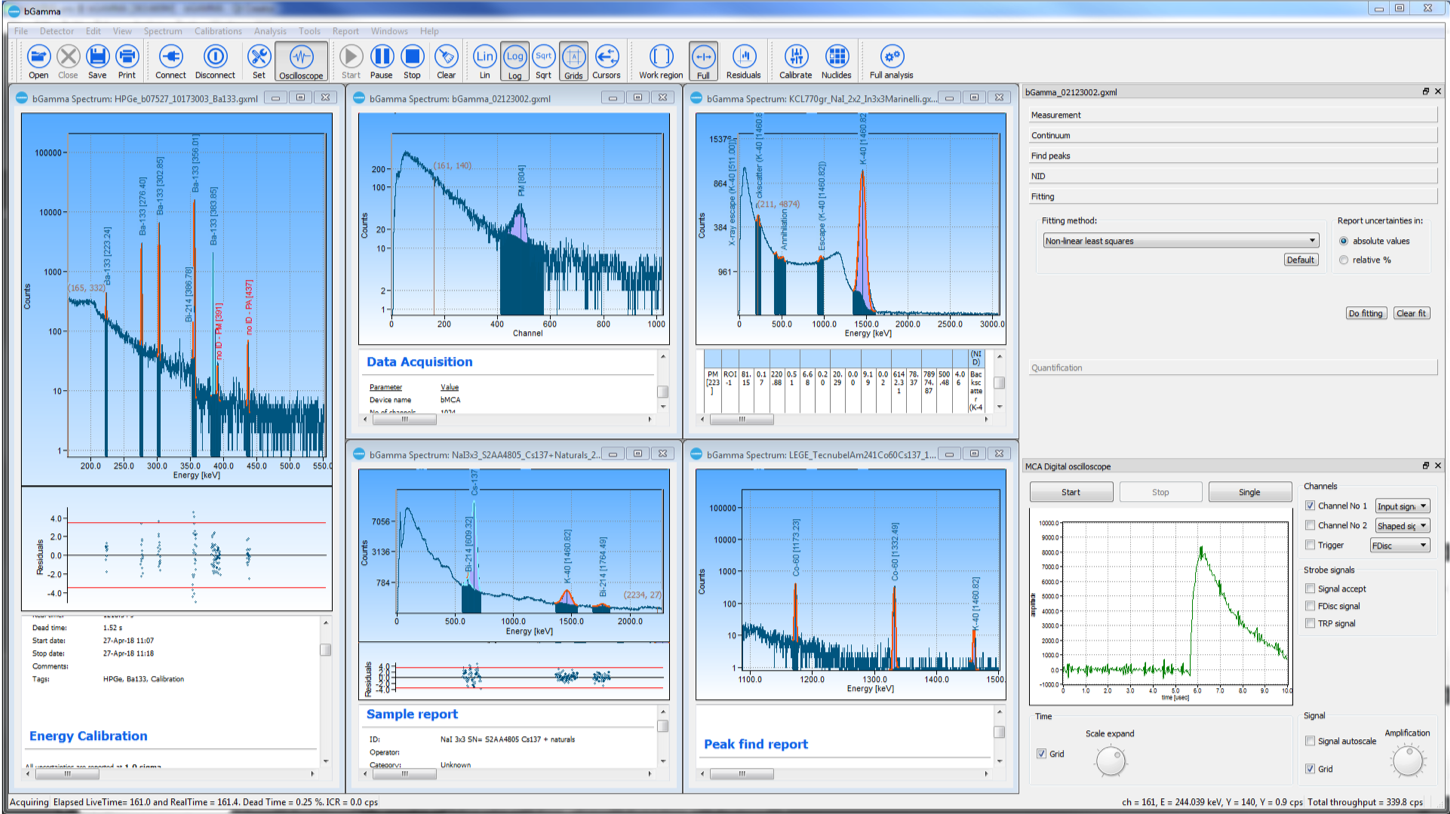
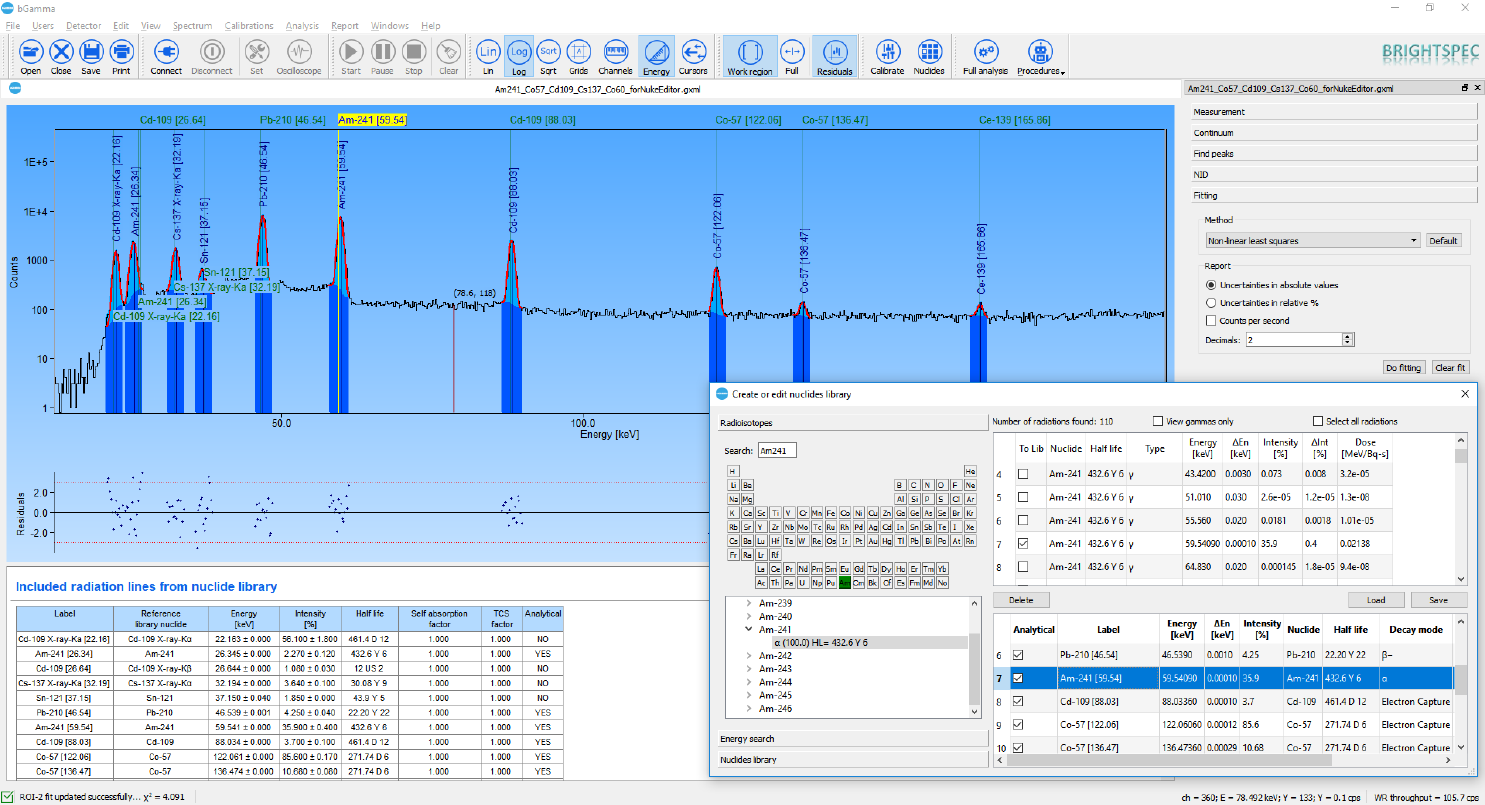
The program has been designed with a very rich, complete and powerful graphical user interface.
Nearly any action on the spectrum analysis can be reviewed through “visual feedback” where every graphical component is automatically updated to show the specifics of the currently selected spectrum.
All the computational results (ROI computations, peaks’ fitting, activity results) can be displayed into dynamically updated tables and the table’s contents can be easily selected.
Any graphical component can be shown/hidden or set to the user’s preferences; creating a convenient, attractive and yet powerful spectrum analysis dashboard.
Among many, the following GUI features are highlighted:
- Display of spectrum analysis fitting residuals
- Individual and distinctly display of each peak fitting component (multi-peaks in ROI, continuum, total peak fit, etc.)
- Colour distinction independence of ROI/peaks categories and/or method of their creation
- Use of context menu commands for most commonly used spectrum analysis operations or dynamically changed context menu independence of the spectrum plot or spectrum analysis situation
- All graphical components and spectrum plot can be set to the user’s preferences
- Spectrum zoom in and out with easy sliding commands and auto-scales
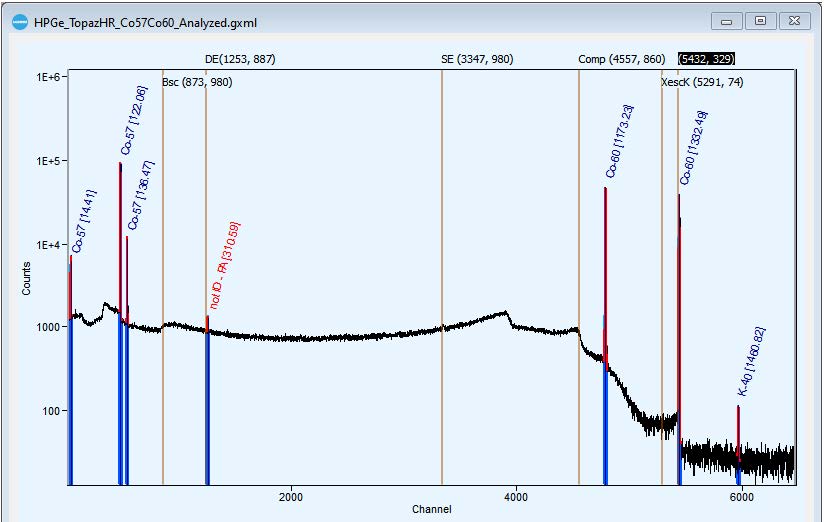
- Spectrum plot scales on different units. X-axis (energy and channels) and for Y-axis (counts or cps) in Linear, Logarithmic or Square-root scales
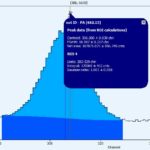
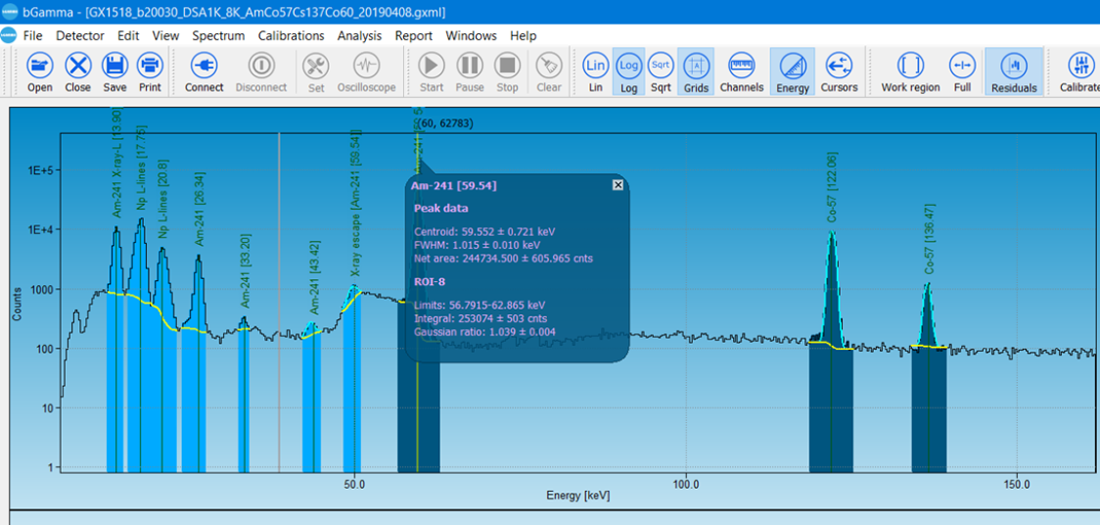
- Peak’s pop-up balloon label with peaks computation results
- Display of “multiple-cursors”. This feature shows the different possible spectrum artifacts (like single or double escape peaks, sum peaks, X-ray escape peaks, Compton edges, etc.). from the current spectrum plot position. The spectrum artefacts to be displayed can be selected from the program’s preferences.
- View of computational results into dynamically updated data tables
- Use of docking and floating windows, which provides easy access to spectrum analysis model parameters.
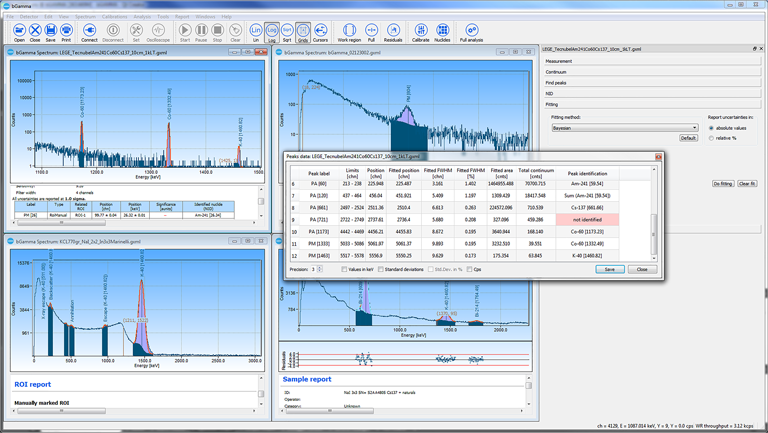
Spectrum Analysis
Highlights:
- Powerful spectrum analysis methods
- Seven peak search methods
- Four spectrum/peak continuum models
- Three peak’s spectrum fitting methods, including “Bayesian fitting”
- All peak fitting data results can be visualized and updated dynamically
bGamma software offers a large number of methods and calculation engines for the spectrum analysis; allowing the user to analyze practically any recorded spectral data independently of its detector type, sample characteristics and used geometry.
These are:
- 7 peak search methods
- 4 mathematical models for spectrum /peaks continuum
- 3 peak fitting algorithm which includes “Bayesian fitting”, a novel peak’s data fitting that does not requires of input of peak shape calibrations.

Calibrations
Highlights:
- Provision of multiple methods for energy and peak shape calibrations.
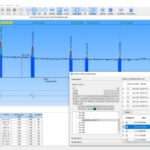
- Calibrations are perform using interactive and visual displays which shows fitted calibration functions, residual plots, experimental points with their uncertainties, etc.
- Input data covariances are taken into consideration when calculating any calibration function.
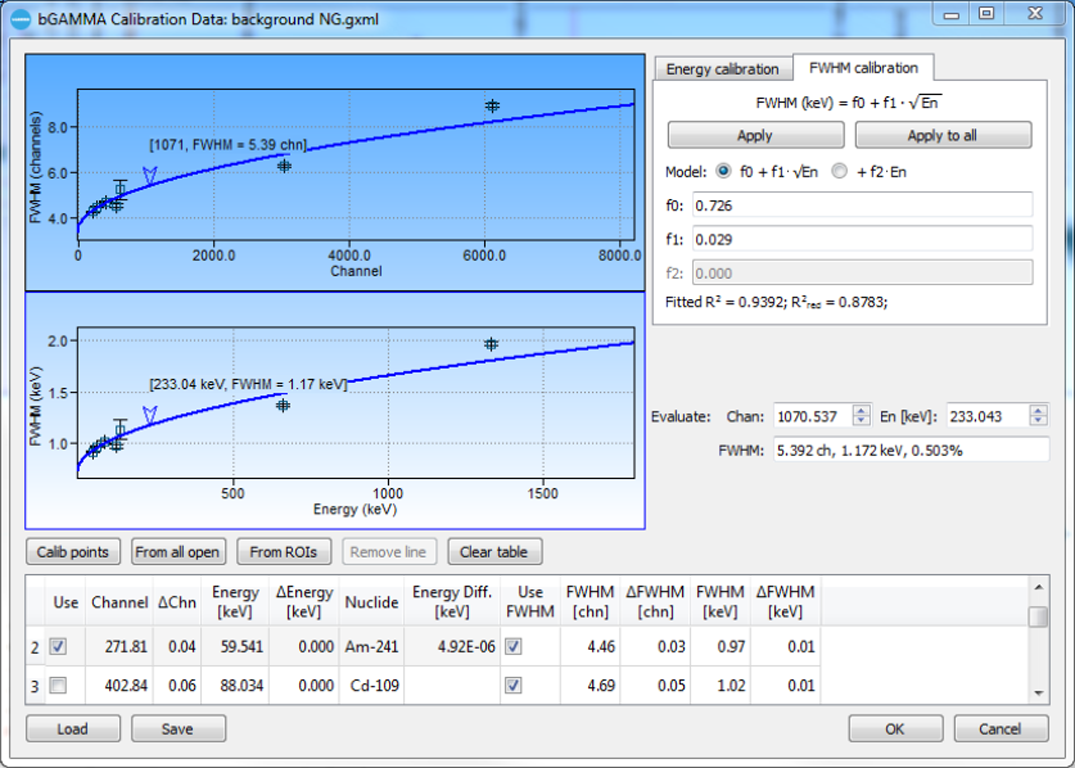
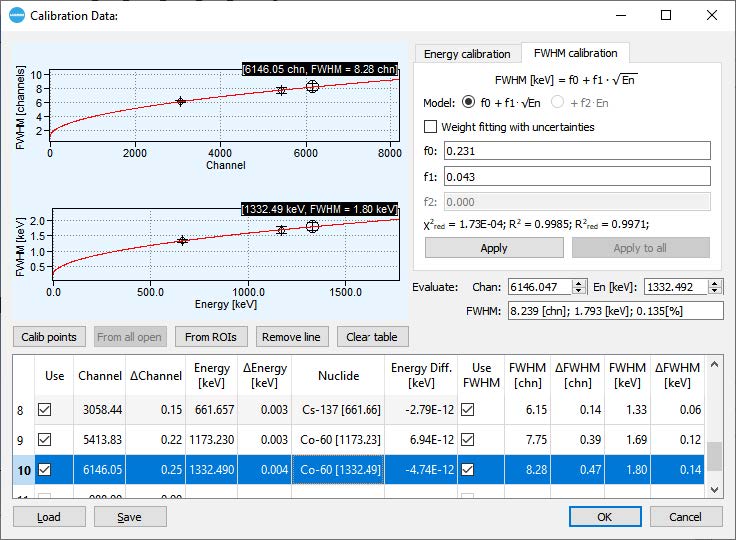
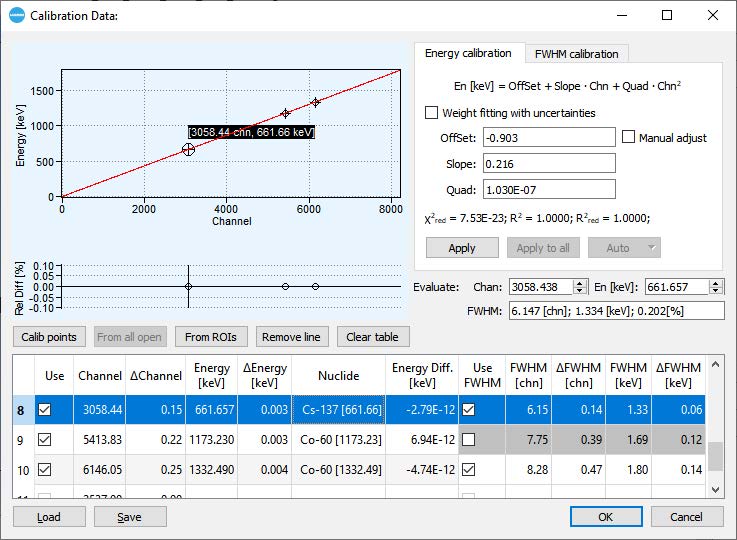
Calibrations are an essential process to correctly analyze any gamma-ray spectrum. bGamma offers all the necessary tools and functionalities to make any calibration. The energy and shape (FWHM) calibrations are unified into one dialogue. They contain a lot of hidden “know-how” for suggesting lines to be used for calibrations independent of the type of the spectrum and detector. A powerful GUI provides visual feedback to the calibration results.
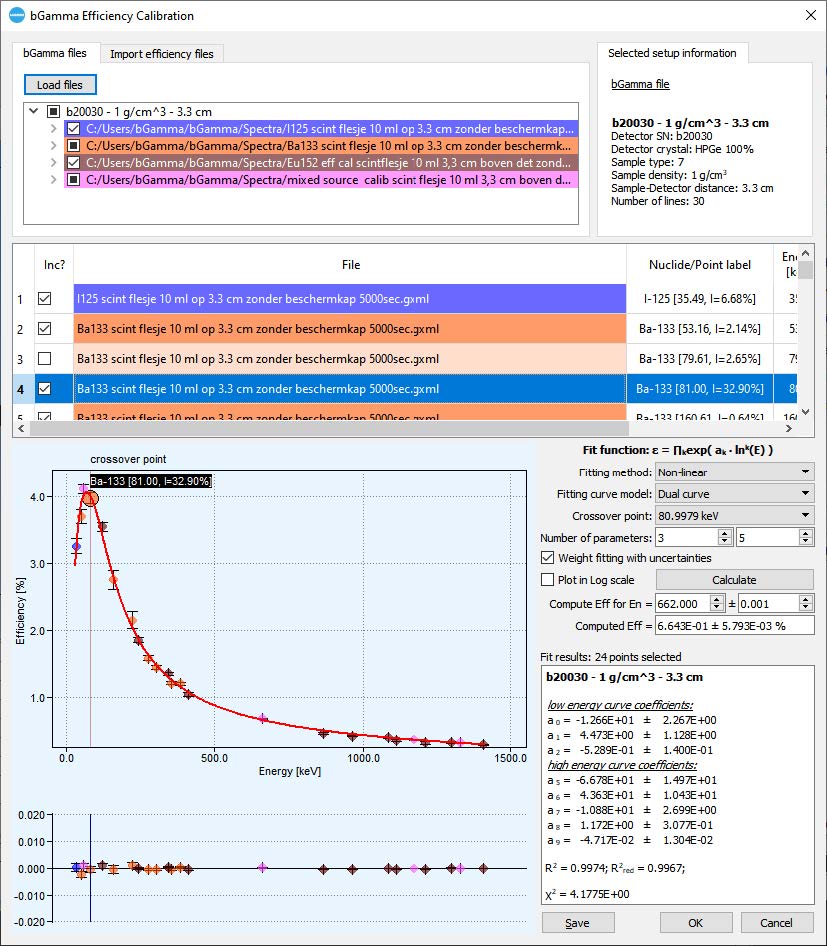
Efficiency calibration uses a versatile fitting engine to derive the complex calibration coefficients in a polynomial of a logarithmic of energy. This calibration dialogue also provides a simple but yet comprehensive GUI for immediate and visual feedback of obtained efficiency calibration results.
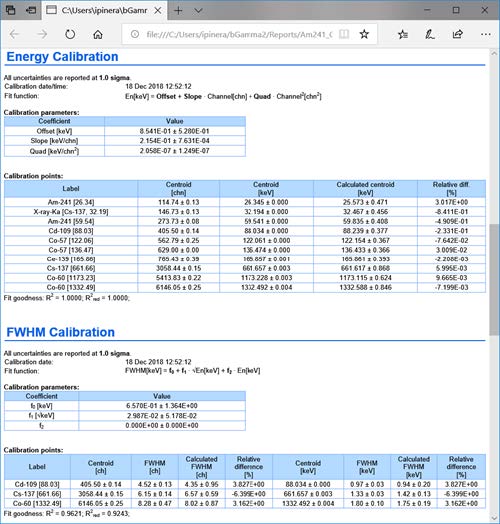
Energy & Shape Calibration
There are many methods and ways to perform energy and shape calibration with the bGamma software:
- Simple energy calibration using spectrum plot cursor and one point (or peak).
- Using several calibration points and interactions with currently marked ROIs in the spectrum
- Automatic with a radiation library input, tagged radiations or single nuclide radiations
- “Manually and visually adjusted” to match the obtained energy spectrum
- Editing the calibration coefficients
Each calibration has its dedicated plot showing experimental points, their uncertainties, obtained calibration curve and differential residual plot.
Efficiency Calibration
Highlights:
- Can fit experimental points to a single polynomial function of logarithmic of the energy (Ln[E])
- Or to two polynomial functions with a user-defined cross over point.
- Provision of plots, individual colors and data points for better visualization and data feedback.
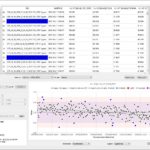
- Exclusion of data points via a context menu and provision of descriptive data labels.
- Automatic data fitting and display of statistical tests results such as Chi2, R2 and R2red.
bGamma uses a polynomial fit to the Ln(E).
Provision of graphical plots containing experimental points and their uncertainties and fitted polynomial curve. The plot includes a cursor with an explicit calibration point (nuclide emission) label for better guidance.
Residuals plot with calculated uncertainties. Includes both a fit to a single polynomial function or a fit to two independent polynomial functions with a user-selectable cross-over point.
Efficiency calibration polynomials are fitted dynamically while the user is changing the input data and/or the mathematical model. The obtained curve is given with statistical results parameters, such as χ2, R2 and R2reduced
The algorithm checks for correctness and applicability of the efficiency calculation conditions (e.g. same detector, geometry, etc.).
An evaluation toolbox is provided for evaluating an efficiency value at currently obtained polynomial fit. Can import experimental points from Canberra LabSOCS/ISOCS™ as well as from generic Monte Carlo calculation codes.
Activity & MDA Calculations
Highlights:
- Activity calculations per peaks or per nuclides
- Reporting of “Weighted activity”
- Report radionuclide activity in different units and normalized to sample weight or volume
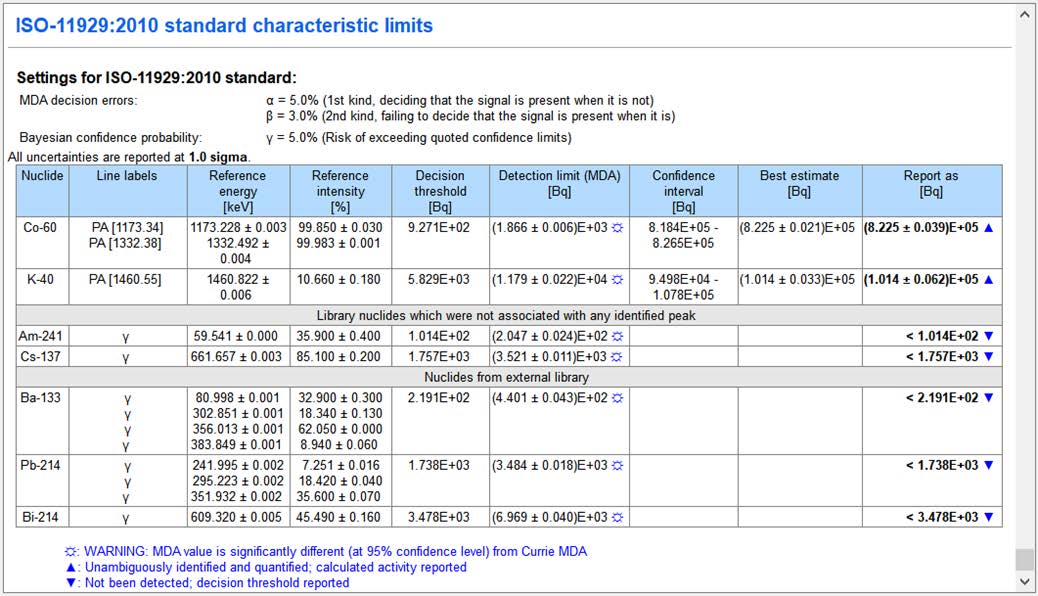
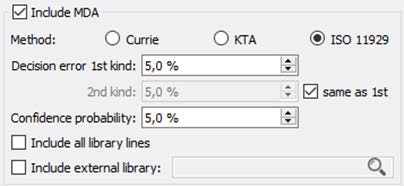
- Provision of multiple methods for minimum detectable activity (MDA), such as: (a) According to ISO-11929 standard (including 2010 revision) (b) KTA (c) Currie or traditional method
- MDA report results with clear flag indications
Radionuclide activity calculations can be performed per peaks, but also per nuclide. They can be normalized to sample weight or sample volume.
Activities can be reported using several radioactivity units.
MDA calculations can be done via three selectable methods:
- According to ISO-11929 (including revision 2010)
- KTA
- Currie (standard method)
In the case of ISO-11929, comprehensive data table are reported with clear indications of decision levels.
Additionally, MDA calculations on the current spectrum can be done against a different (secondary) set of nuclear radiations or nuclear library.
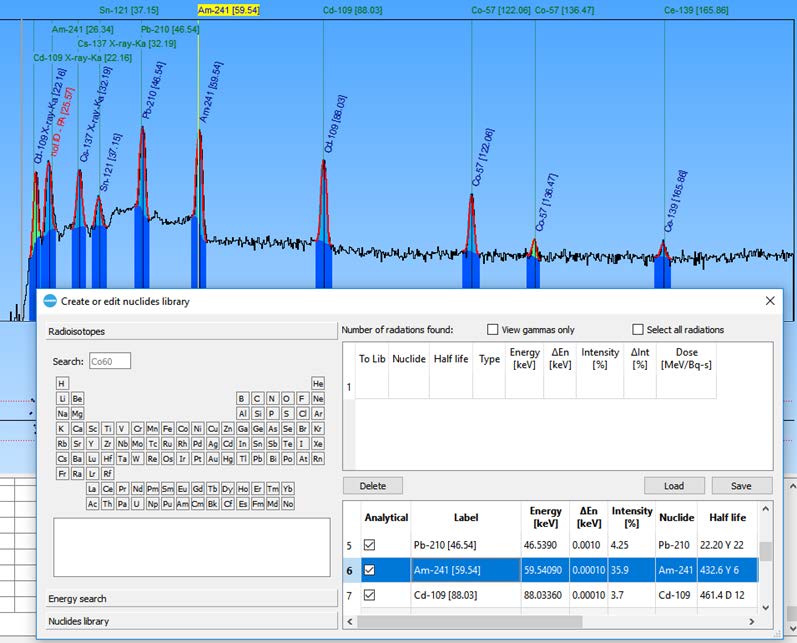
Nuclide Library
Highlights:
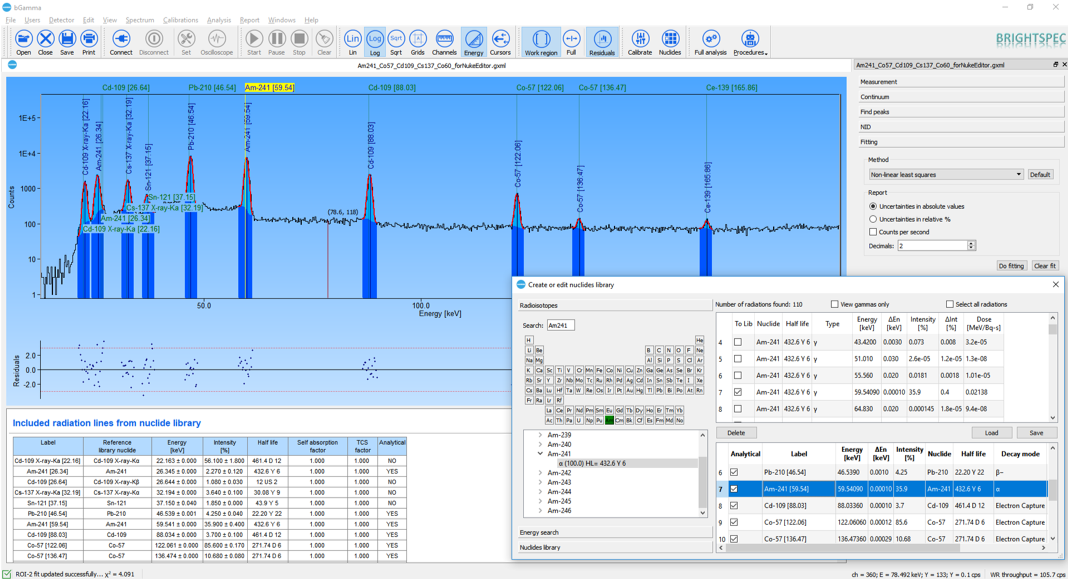
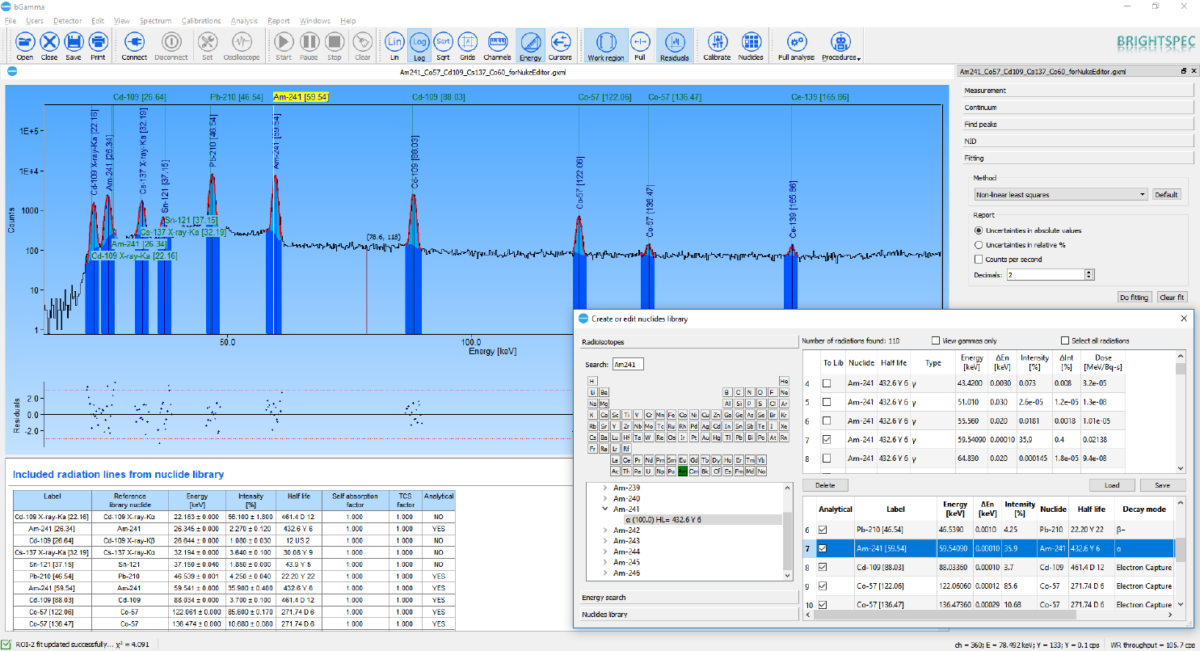
- Fast data handling techniques allow the inclusion of the entire decay data radiations into the software. Providing fast access to any nuclear radiation from any part of the program or step of the spectrum analysis
- bGamma uses NuDat data files as the provider of decay radiation library information
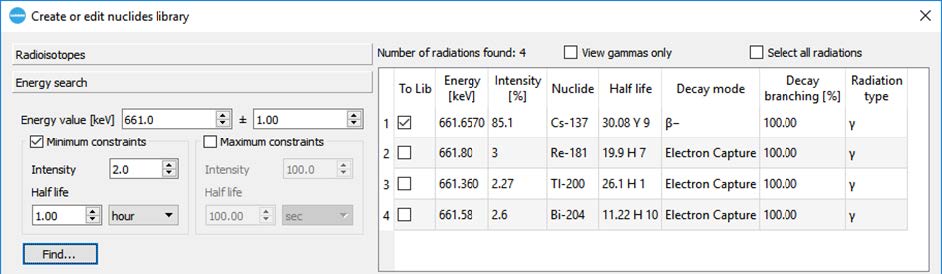
- Provides advanced techniques as generic “CTRL+F” for radiation search or “guess nuclide”
- Nuclide radiations can be “tagged” and quickly recalled at any time or step
In bGamma the traditional concept of “nuclear library” is unnecessary. All the radiations from nuclear decays are embedded into the program and easily and very fast accessible; thanks to a novel data handle technique implemented into the program.
This data handling method allows access to any library nuclear radiation with no noticeable delay and from any part or step of the spectrum analysis.
bGamma embeds data from the well-known, maintained and evaluated nuclear data library NuDat This approach improves the recognition of any radiation present into the spectrum as well as any step of the spectrum analysis (e.g. energy calibration, efficiency calibration, nuclide identification, etc.).
It also allows the user to perform novel spectrum analysis functionalities like:
- Online and extensive library radiation search
- Use of “tagged” radiations
- Perform a generic (Ctrl+F) search from anywhere in the spectrum
- Implements peak “guessing”
And much more.


Reporting
Highlights:
- HTML-based reports
- Each spectrum has its own individual report
- Reports are rich formatted using colours, data tables and inclusion of graphical plots
- Create user-defined reports using HTML coding and report templates/blocks
- Data results are coloured if results are statistically doubtful
- Reports can be saved into HTML or PDF files
bGamma employs rich, colourful HTML-based reports that include graphical data and numerical tables. Statistically, doubtful data results are flagged and coloured independently of their criticality. Each spectrum/document has its own individual report displayed in the spectrum report panel.
Reports contents and layout can be changed to user’s preferences using the report template editor. Report templates are based on plain HTML-based commands and scripts.
Reports can be saved as HTML or PDF documents
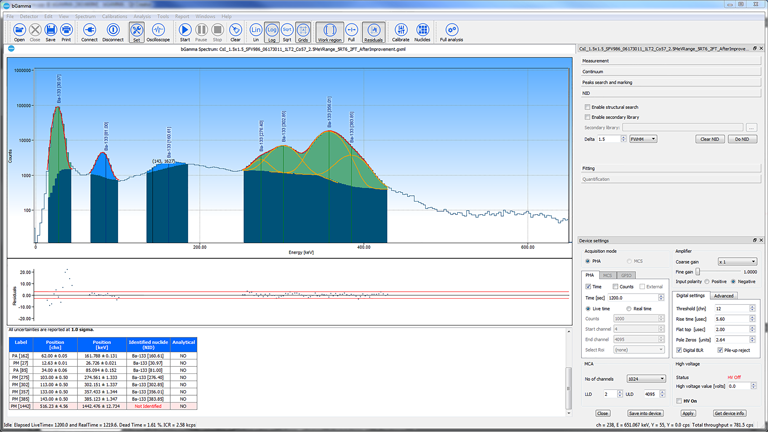
Data Acquisition & Hardware Control
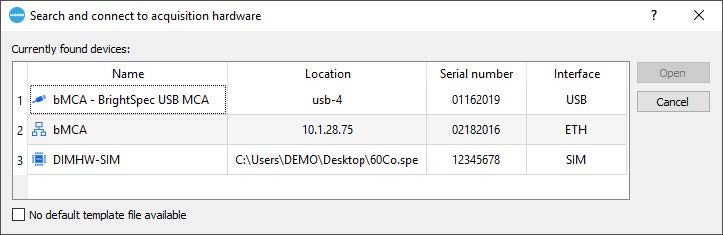
Using bGamma software you can connect to any BrightSpec device, set it up and perform data acquisition. The connection dialogue will automatically search for available devices in your PC or network for connection.
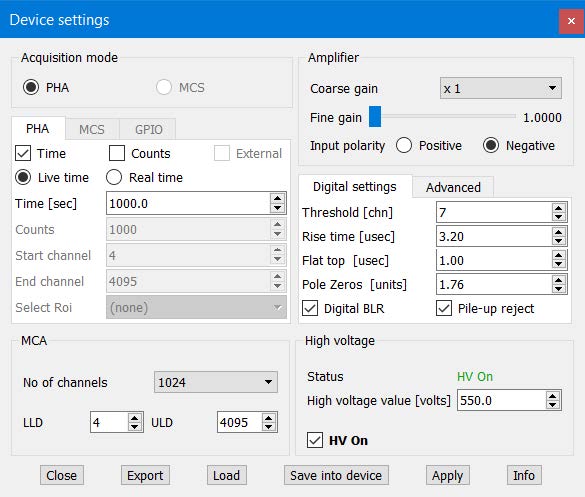
The parameters of each individual device are properly shown using its device control widget.
The widget will automatically detect the device’s capabilities and enable/disable the corresponding controls. Using the device control you can manage any hardware parameter from the basic ones to the most sophisticated and dedicated ones. The settings can be conveniently stored into or load from a file.
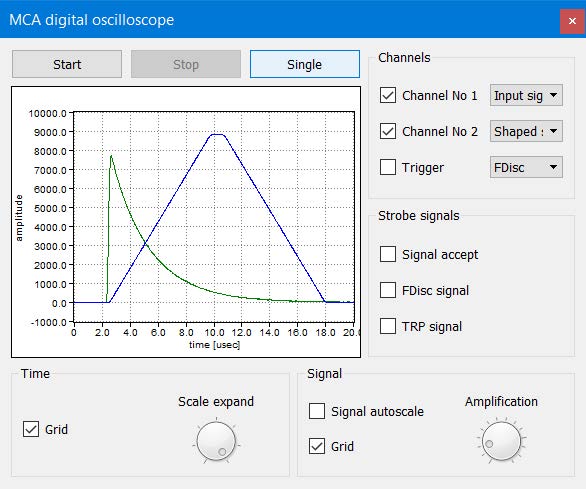
The software incorporates a dedicated toolbar for hardware control and data acquisition. It also provides a two-channel digital oscilloscope. Using this tool you can review the electronic pulses, fine-tune your device’s settings and/or troubleshoot any potential problem.
- Connect to any BrightSpec device
- Setup and control data acquisition via device control widget
- Incorporates a two-channel digital oscilloscope for signal inspection and device’s troubleshooting